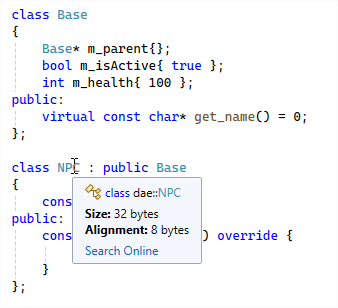
What about these?
class Base
{
    Base* m_parent{};
    bool m_isActive{true};
    int m_health{100};
  public:
    virtual const char* get_name() = 0;
};

class NPC : public Base
{
    const char* m_name{};
  public:
    const char* get_name() override {
        return m_name;
      }
};
Persistent memory – memory that survives a reboot of your device.
SSD – Solid State Drive.
HDD – Hard Disk Drives. Moving parts – slower, but more capacity (for now)
Remember the old days when we had these things like … DVD’s?
What is the difference between an SSD and a HDD, does anyone know that?
HDD’s have moving parts, with an arm seeking positions on a disk, making it slow.
SSD’s don’t have that problem and are thus way faster.
rpb = framepointer
eax = register
source: Computer Architecture: A Quantitative Approach by John L. Hennessy, David A. Patterson, Andrea C. Arpaci-Dusseau
How slow? Very slow. One fetch can take thousands of CPU cycles, leaving the CPU waiting idle
Say we have an instruction that needs to operate on a value in memory (blue)
We fetch the cache line containing the variable, and store the value into the CPU’s register, which can perform his instruction now.
Say we need another value for our operation, that is located somewhere else in memory.
We need to fetch it too, and here we have a cache miss.
Say we want to perform the same operation again but on two other values. Here we have a cache miss.
If we locate the data we need for our operation next to each other, we have a cache hit for the second value
Even better, the next operation can also continue without memory access
The one without the pointer :)
If your code is accessing data in all separate places, you would have cache misses on the data
Or vice versa, if you jump through the code’s virtual methods that are every where in memory, you would introduce cache misses on your nice contiguous instructions.
They’ll probably answer the 2nd, but why? Not because the algorithm might be too complex for this simple case, but because of the potential cache miss this introduces. Of course, compiler optimization will probably fix this But: no premature optimization!
fd = no mans land, used by the debugger to detect buffer overruns
dd = unused free memory
cd = newly allocated memory
fd = no mans land, used by the debugger to detect buffer overruns
dd = unused free memory
cd = newly allocated memory
fd = no mans land, used by the debugger to detect buffer overruns
dd = unused free memory
cd = newly allocated memory
32b in x64, 20b in x86
Red – the canaries
Yellow – The vtable pointer
Green – m_parent
Blue – m_isActive + padding
Purple – m_health
Orange – m_name
32b in x64, 20b in x86
Red – the canaries
Yellow – The vtable pointer
Green – m_parent
Blue – m_isActive + padding
Purple – m_health
Orange – m_name
Not all particles are active at the same time, so we check. Introduces a lot of cache fetches that are often not needed
How do we fix? - Open question, many solutions possible…
One: keep active particles together in memory by swapping their data around and keeping track of how many active particles there are. Can't do this with pointer swapping, so potentially this moves a lot of memory around.
Is a tradeoff, what is cheaper for the use case you have? MEASURE before optimize.
Problem: AIComponent has a lot of data. Can't fit all of it or too few in a cache line.
Open question: how do we fix that
Solution: we split the data into hot/cold. Only data in the hot path should reside in the AIComponent and be used in the update function. The cold data we separate into another object and we just point to it.
We access every cacheline for every step, causing the timing to match the expected result. But what we don't want is the height of the graph.
Let students fix it according to AIComponent example
Again, we flatline until k = 8 (because sizeof(GameObject3DAlt) = 8 instead of 4 as in the previous example)
But compare it with the GameObject3D and you see the massive gain, until k = 16 - then we're in the same boat again.